
How to use the Energy Comparison Spreadsheet to tune car and track setups
We have a free to download Excel spreadsheet to calculate the energy in a system which is designed to be used with the Race Timer and Speedometer. It can be used as part of a STEM lesson or project and to analyse the performance of your cars or tracks. After two simple measurements, use the Cook’s Projects Race Gate (also known as the Race Timer and Speedometer) to measure the speed of the car. From this data, the spreadsheet can calculate the energy of the car and the efficiency of the setup. You will need a computer and software compatible with Excel spreadsheets to run the program on.
The free download of this spreadsheet is available from our Store

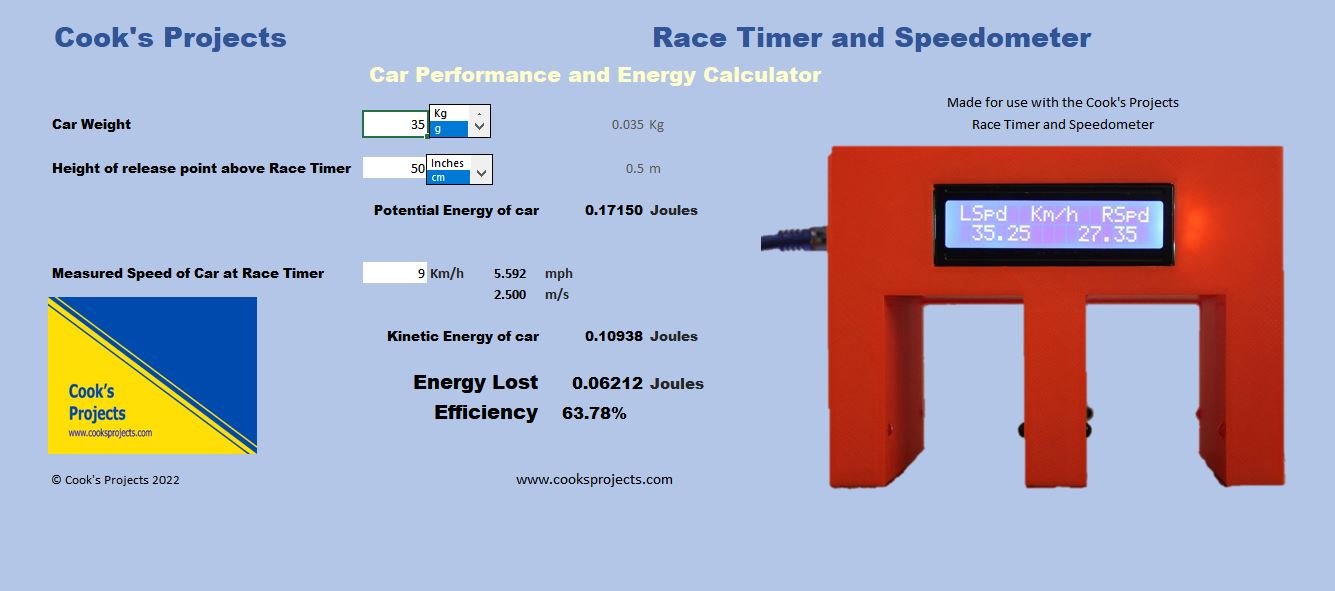
In order to calculate the energy of a car, the weight of each car you are measuring is needed. The spreadsheet accepts Kg, g, or imperial lb and oz. The height change between the car release point and the Race Timer is also required. On a flat surface, simply measure the height above the surface of the release point and, if required, the height above the surface of the track running through the Race Timer and Speedometer. This height change, or drop, can be provided in m, cm, feet or inches. Select the units in the list box next to the input.
The final measurement needed is the speed that the car is travelling. The Race Timer can provide this in either race timer or speedometer mode. The unit displays the speed on the LCD in Km/h (or MPH with the imperial version) and this is the input expected by the program. If you are using the datalink version, simply copy the speed from the serial terminal window. The speed is also displayed by the spreadsheet in km/h, mph and metres per second for reference.
With this data, the difference between the starting energy of the car (the potential energy) and the energy of the car at the Race Timer (the kinetic energy) is calculated and displayed. The difference, or energy loss, is calculated and is also displayed as a ratio of remaining energy and it’s starting energy level. So 100% would indicate nil loss of energy, or a frictionless, perfect environment. While 0% would mean that the car used all the available energy before reaching the Race Timer. You can find more detail on the science here. (Note: the law of conversation of energy reminds us that energy cannot be lost; simply changed from one form to another. So when I am referring to ‘energy loss’ I scientifically mean conversion of potential energy into sound, heat or track movement.)
You can use this data to compare changes made to improve the running of your car. These may be changes to the track, like initial steepness of the descent or fixings to reduce track movement; or refinements to the car by using lubrication, straightening the axles or changing it’s weight. The program can assist with the analysis of your car collection to determine the best car for a particular track. Very useful for our users that are part of the RedLine Derby Racing Group (https://www.redlinederby.com/).
The Cook’s Projects Race Timer can be placed anywhere that has a straight section of track. So detailed data can be obtained in a specific area or section of the track to help understand the affects of track adjustment.
As part of a STEM (science, technology, engineering, mathematics) lesson or experiment, you can show how efficiency varies depending on a number of factors. For example, you can show how speed is related to height of release or show that the most energy efficient car may well be the fastest at the finish but may not be the car that travels the race distance the quickest. (Hint: The acceleration profile will be different.)
The Race Timer and Speedometer (now known as the Race Gate) with the datalink version is optimised for these type of detailed and multiple measurements. Using this version, the Race Timer is able to provide the speed, to 4 decimal place accuracy, measured times in microseconds and every car’s data is recorded allowing analysis of multiple runs. The data can also be ‘copied and pasted’ from the output into a spreadsheet saving time and preventing errors in data transposition. The data can also be copied into other documents making race reporting and analysis easier.
The Science
With the weight and height of the car, the potential energy of the car is calculated. Potential Energy, or PE, is calculated by multiplying the mass of the car with the acceleration due to gravity and the height. PE = mgh. Using SI units, mass (m) is measured in Kg, acceleration due to gravity (g) in metres per second per second and height (h) in metres. If you prefer imperial measurements the spreadsheet takes care of any unit conversion. Energy is measured in the SI units of Joules. Once the speed of the car is measured, the Kinetic Energy, or KE, of the vehicle can be calculated. Kinetic Energy is also measured in Joules by taking half of the mass of the car (in Kg) and multiplying it by it’s speed (or more scientifically correct, velocity) squared (in metres per second). The spreadsheet does all the work in converting units for you.
The energy ‘lost’ between the starting point and the end measurement is an indication of the efficiency of the system. (Note: Energy is never lost! It can only be changed or converted - The law of conservation of energy states that energy cannot be created or destroyed; only converted from one form of energy to another.) This energy conversion (loss of ‘useful’ energy) will occur as heat, track movement and sound. The energy converted is calculated and displayed as well as an indication of the efficiency of the system by taking the energy remaining and comparing its starting energy.
Watch the video